Infography Lifetime Deal
Creating clear and engaging visuals from data can feel challenging. Many people spend hours trying to make charts, reports, or infographics look neat and professional.
Sometimes, even with design tools, it’s hard to format everything correctly or choose the right layout. This makes reporting, presenting ideas, or explaining concepts slow and stressful.
Infography make this process simple and fast. Instead of struggling with complicated design software, you can turn your data, text, or ideas into ready-to-use visuals in just a few clicks.
Whether you need charts, infographics, reports, or slides, Infography gives you clean templates, smart designs, and easy drag-and-drop tools to build visuals that look professional.
Anyone can use it—students, teams, teachers, marketers, or business owners. No design skills needed. Infography help you share information in a way that is easy to understand and visually clear, so people instantly get the message.
Overview Images
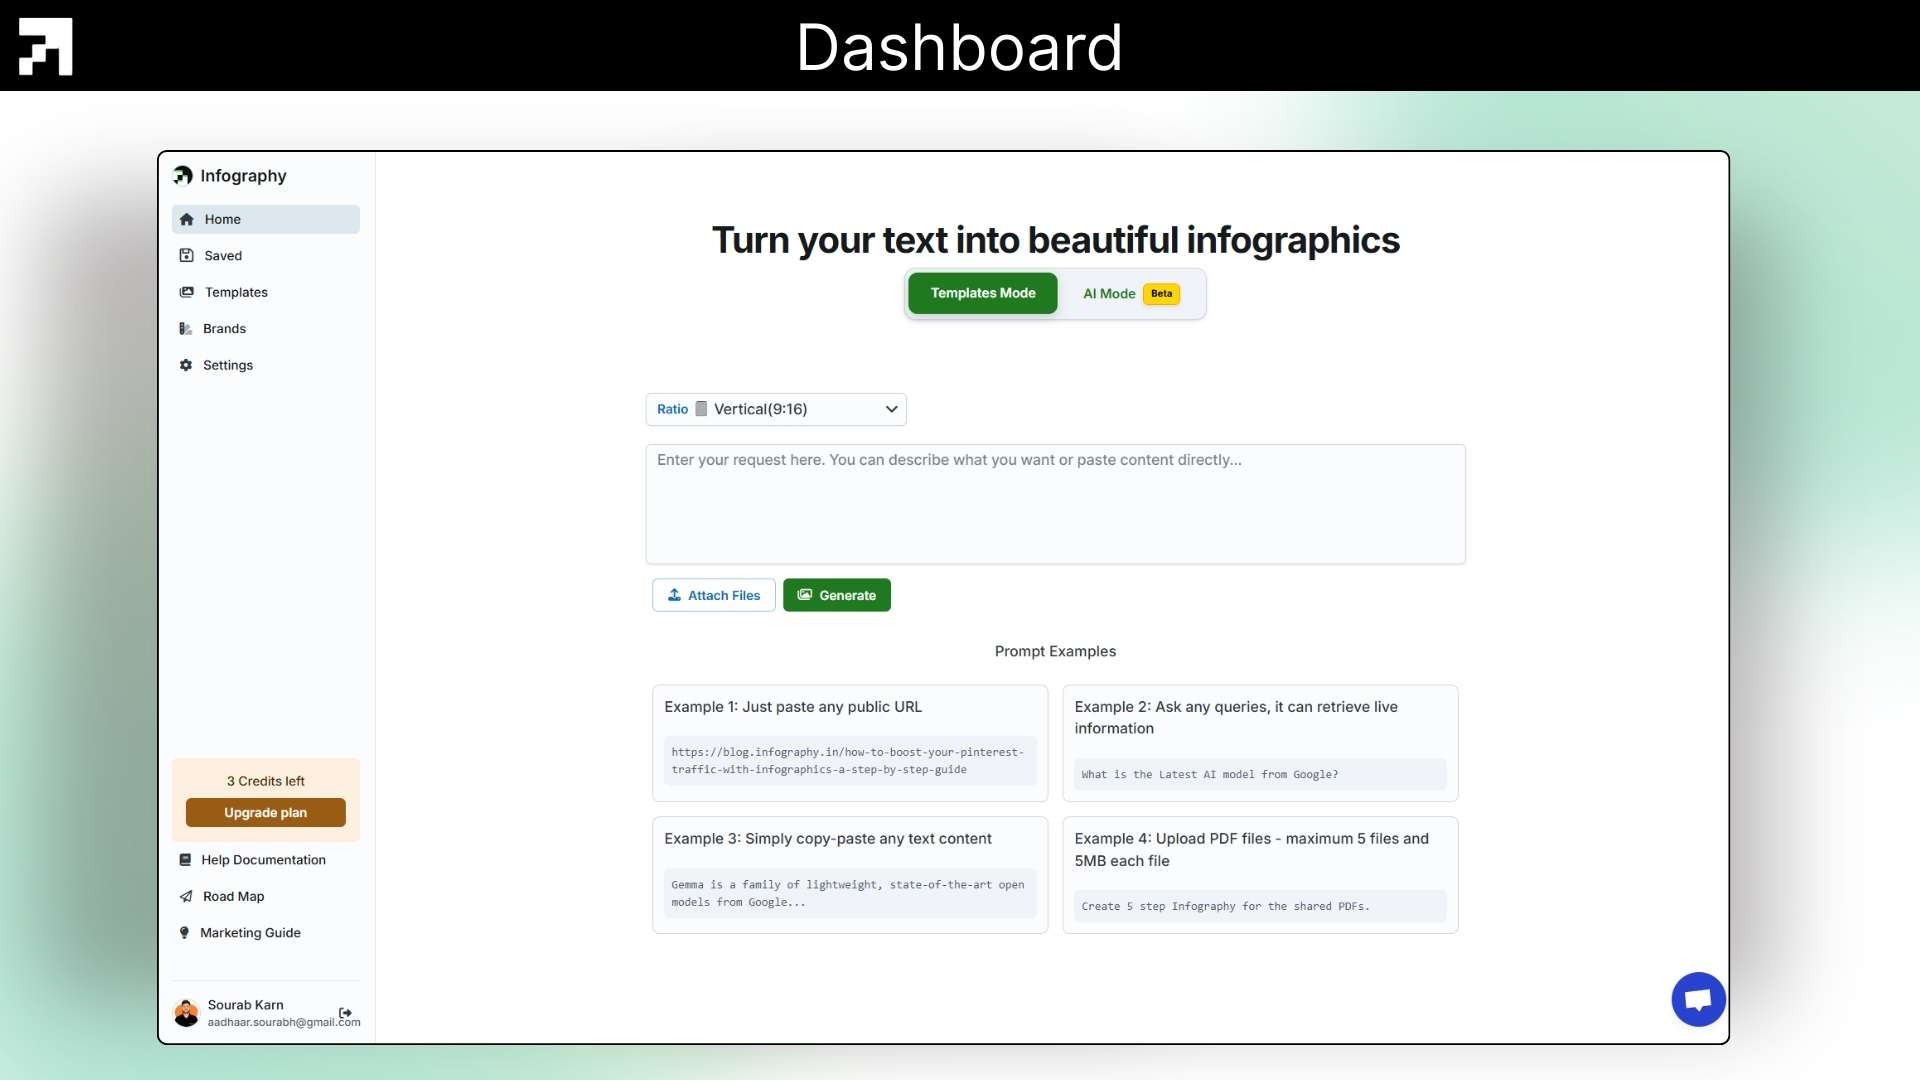
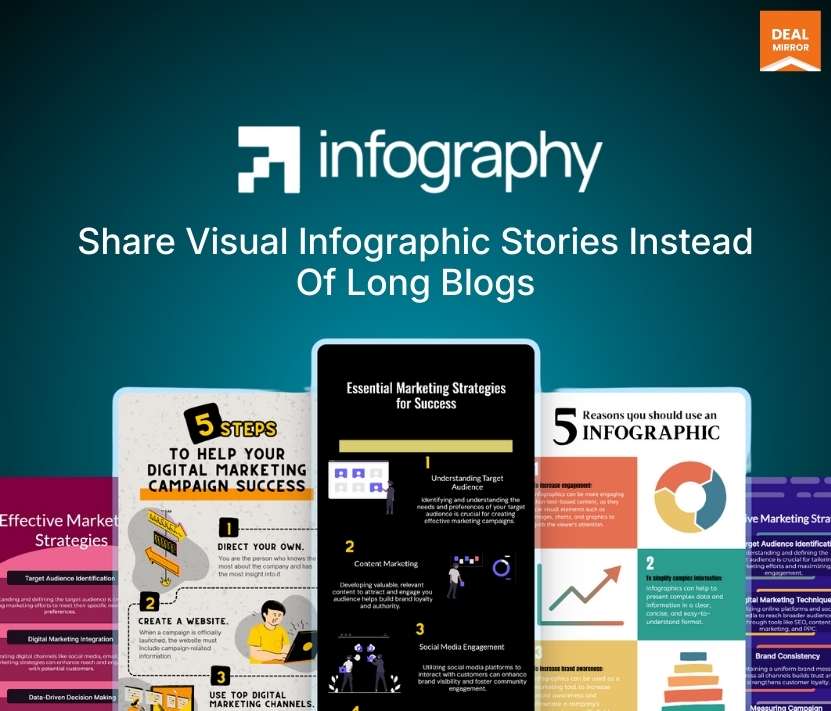
Infography is a smart, AI-powered tool that lets you turn your long-form blog posts, content, or other data into attractive, easy-to-understand infographics that look professional.
Key Features
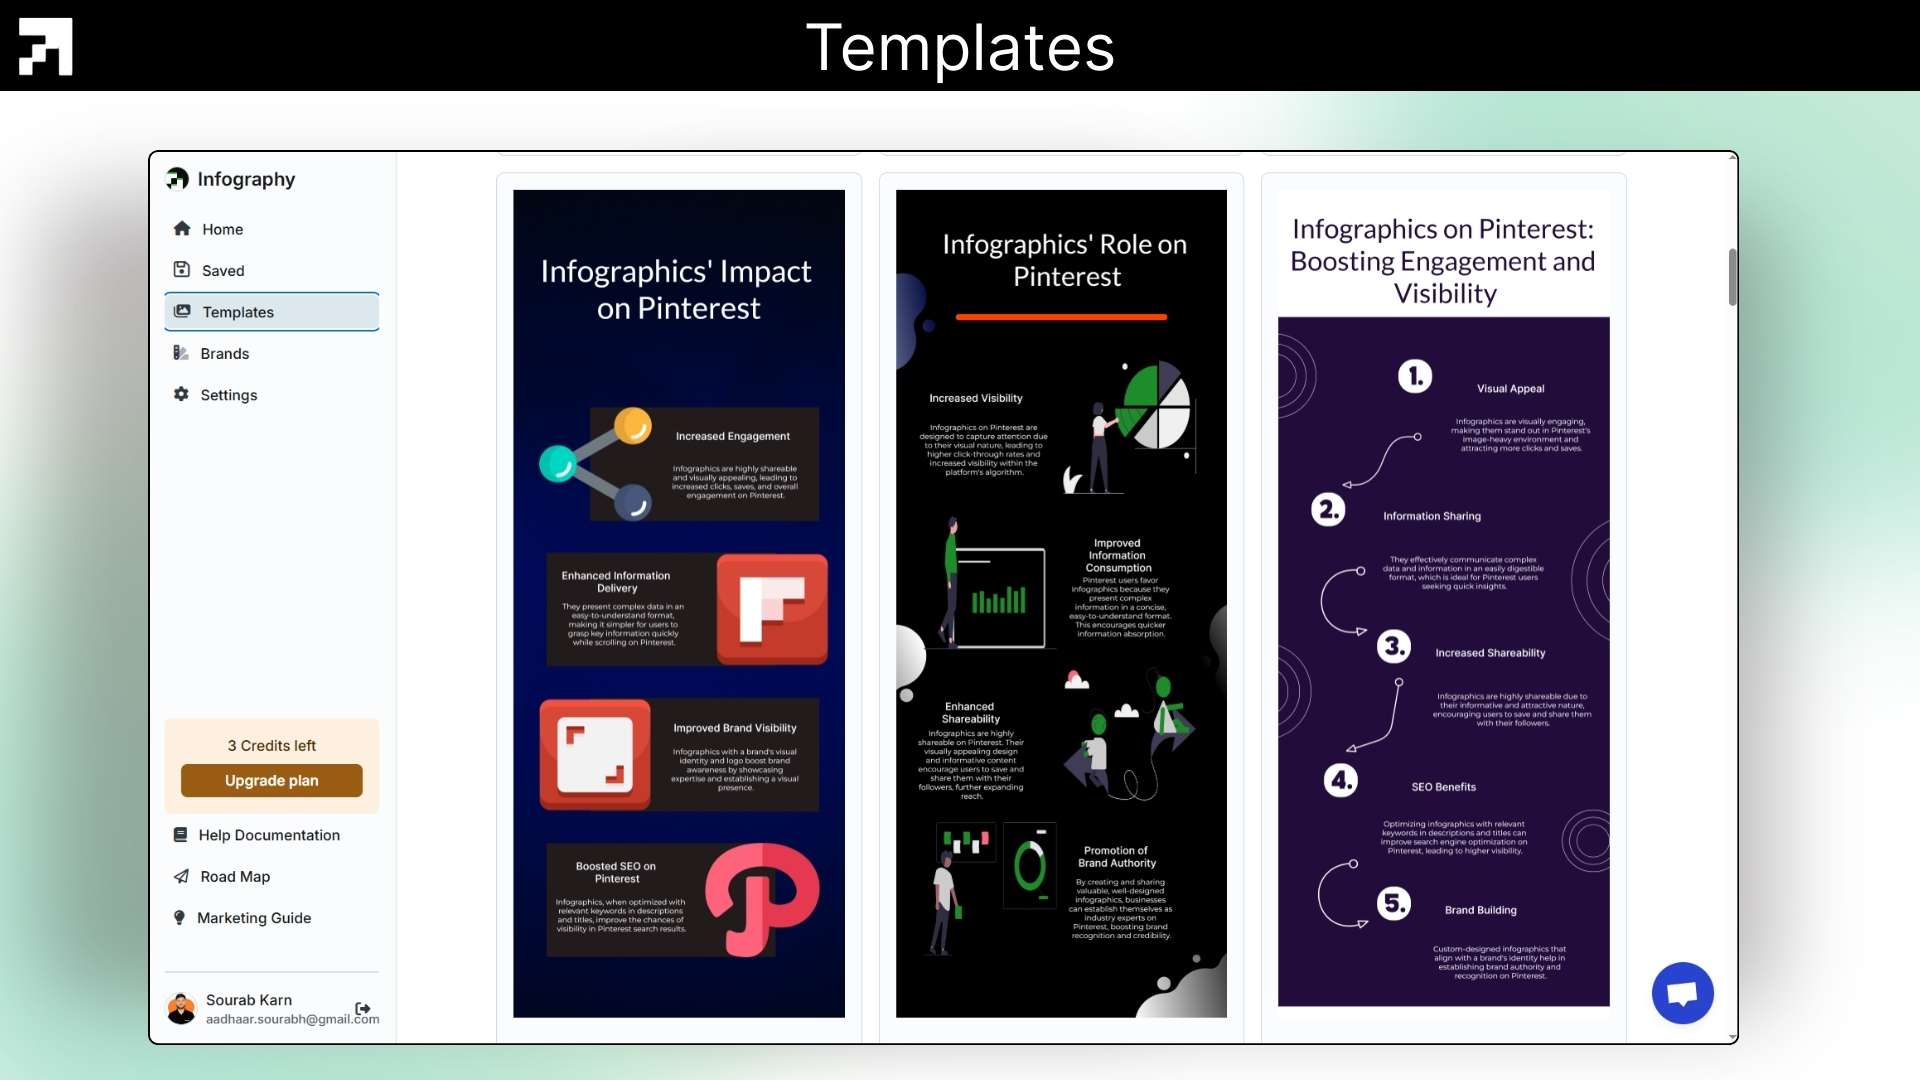
- Ready‑Made Templates: Choose from professionally designed templates for social posts, ads, posters, resumes, reports, and more.
- Smart AI Suggestions: Get design tips, layout fixes, and color suggestions while creating, like having a mini designer by your side.
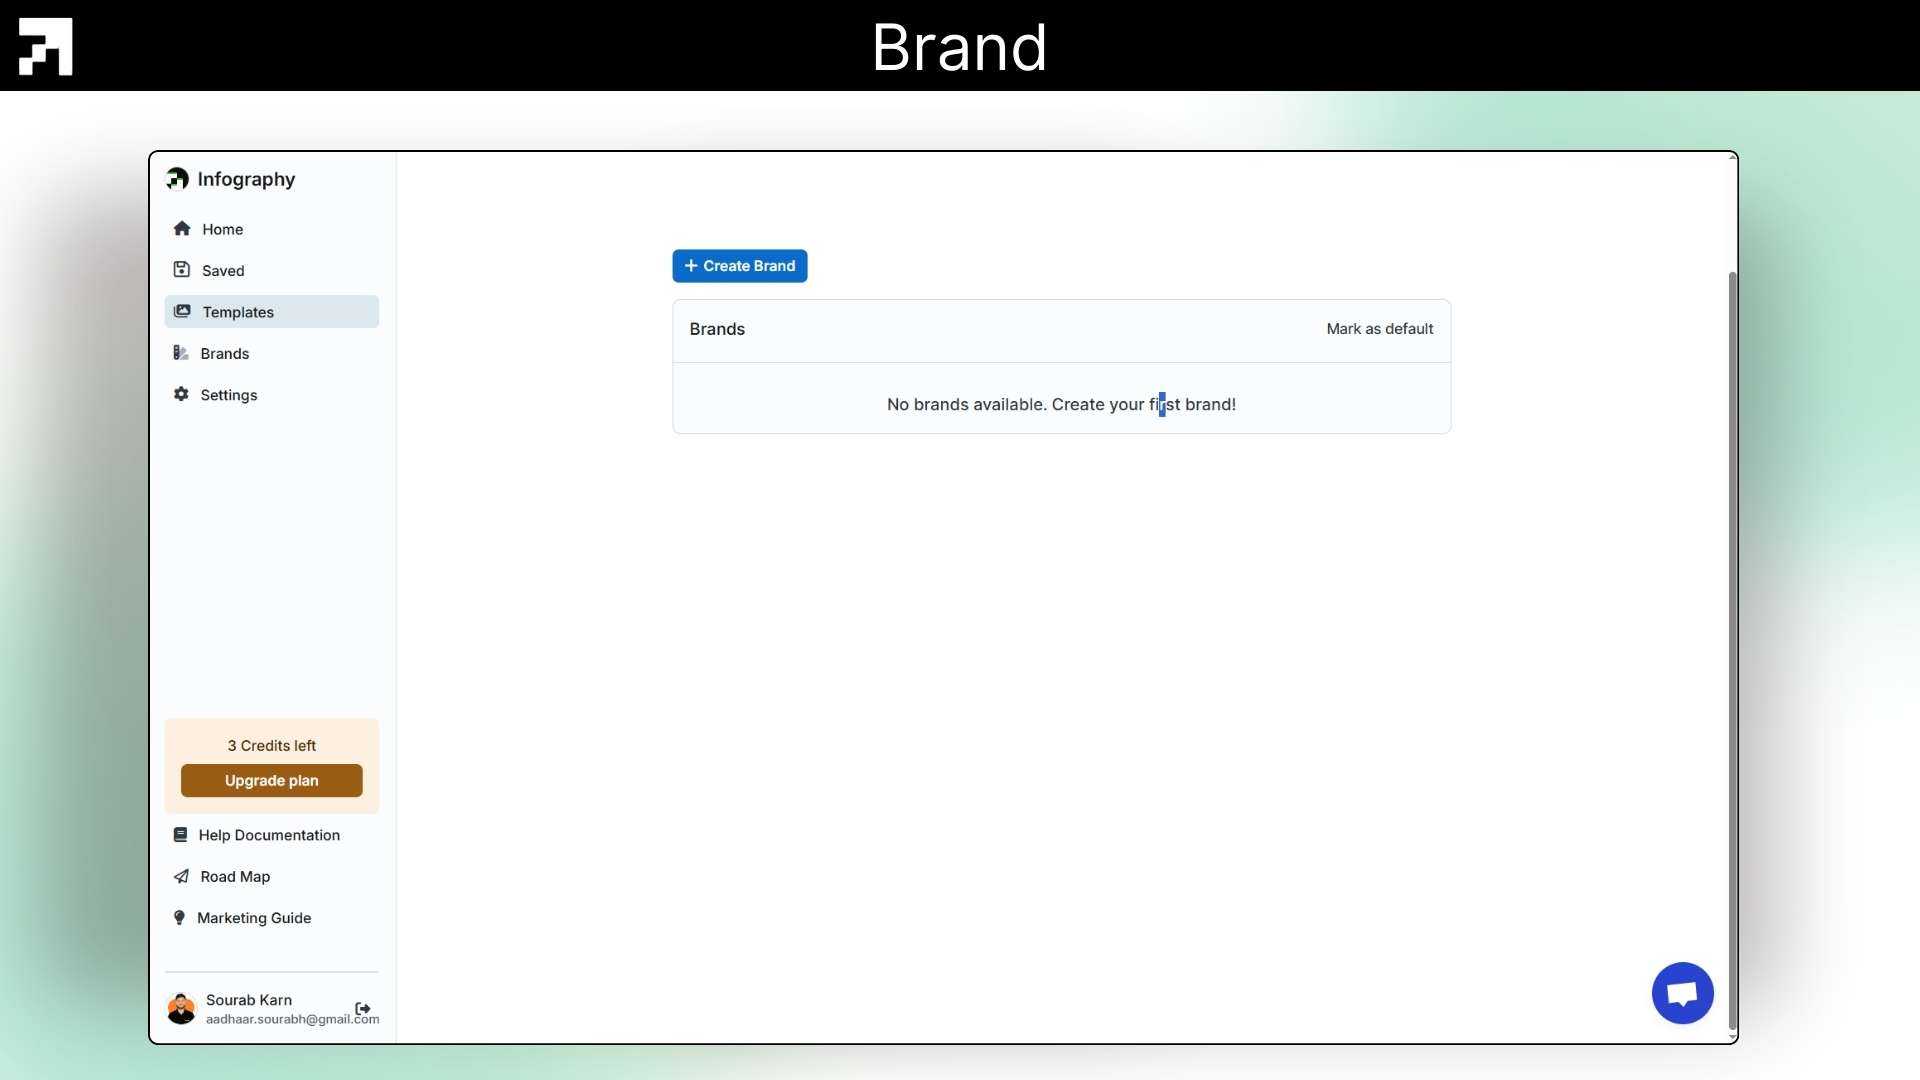
- Brand Kit Support: Upload your logo, fonts, and colors once, and keep all your designs consistent with just one click.
- Team Collaboration: Invite team members to view, edit, or give feedback inside the same project; no more back‑and‑forth emails.
- High‑Resolution Export: Download your design in the best quality for printing, digital use, or social media.
Use Cases:
- Businesses: Use Infography to create product explanations, pricing charts, process steps, or brand introductions. Perfect for making complex business information easy to understand.
- Teachers and Schools: Turn lessons, history timelines, science chapters, or class notes into fun visual infographics so students learn faster and remember better.
- Students: Create project presentations, assignment summaries, exam revision charts, or topic breakdowns in a visual format to make studying easier.
- Social Media: Creators design carousel posts, how-to guides, meme-style breakdowns, or storytelling content that gets more likes, shares, and engagement.
- Agencies and Freelancers: Build client reports, marketing overviews, competitor comparisons, or performance dashboards that look professional and are easy to read.
Deal Terms
- Length of access: Lifetime Access
- Redeem your code within 60 days of purchase
- 30-Days Money-Back Guarantee (For Non-Prime Members and Regular users)
- 60-Day Money-Back Guarantee (For DealMirror Prime Members Only)

3 reviews for Infography: Turn Your Blogs Into Stunning Infographics with the Power of AI
Kimmykins –
Infography revolutionizes infographic creation! Turn dry data into visual feasts, making your blog content instantly eye-catching.
Balaji Varatharajan –
Infography allows me to create visuals/infographics from a blog. I gave my own blog post as an input; it was able to understand and managed to create stunning visuals.
Alex Carlson –
Turn any blog post into an infographic in 30 seconds. It uses Google’s Gemini 2.5 Flash Lite to transform long-form content into visual stories, supporting 130 languages.