Home » Store » Sprucely: Transform Your Data into Interactive And Customizable Dashboards
Sprucely: Transform Your Data into Interactive And Customizable Dashboards
TL;DR
Quickly convert complex data into interactive and visually engaging dashboards
Customizable layout and theme options to match your brand, with easy sharing and embedding
Alternative to: Tableau and Qlik
Best for: Executives, Finance, HR, Marketing, Medical, Projects and Sales
Sprucely Lifetime Deal
Are you a company owner struggling to make your dashboard visually appealing?
Look no further!
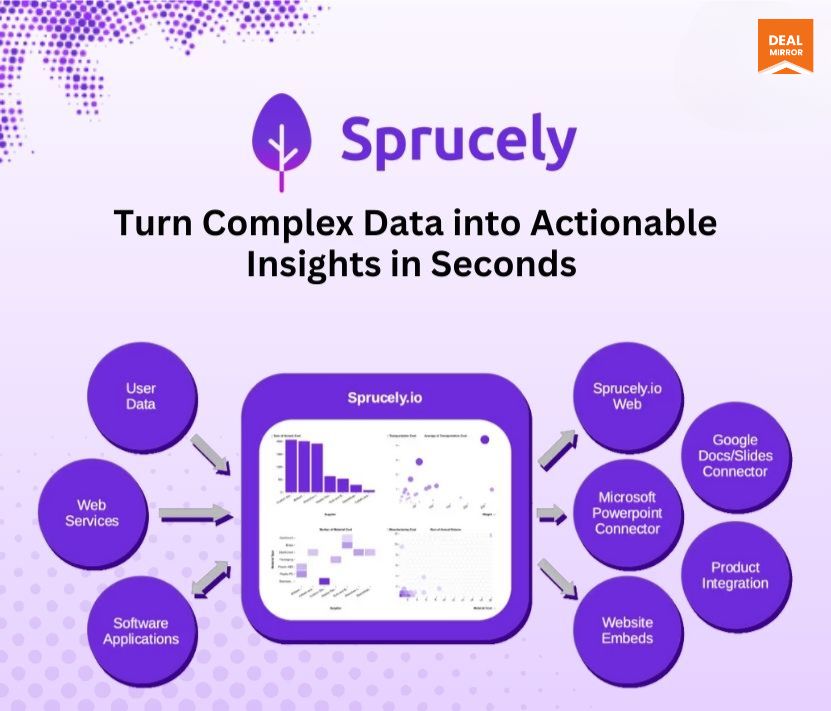
Meet Sprucely lifetime deal, a cutting-edge dashboard software that turns data into visually engaging, interactive decision intelligence. It automates your data insights pipeline, easily pulling data from multiple sources and transforming it into actionable insights in seconds.
With Sprucely, you can easily integrate real-time data and instantly visualise it, saving time and effort while enhancing your decision-making.
Whether you’re tracking sales, performance, or customer behaviour, Sprucely empowers you to visualize and make sense of your data instantly.
The built-in dashboard editor in Sprucely lets you customize layouts and themes, enabling you to incorporate your branding easily.
Once your dashboard is ready, you can share it via the web or embed it into documents, presentations, or websites—all in seconds.
Demo Video
Sprucely is a visual analytics software that automates data insights, transforming complex data into interactive, customizable dashboards for fast decision-making.
How Does It Work?
Step 1 : Select Your Data Source
The flow starts by defining the source of data. You can import into Sprucely a local data file (either for storage in the cloud or on-premise) or reference data that can be directly downloaded from a regular HTTP request (for example, JSON data that is served dynamically by a separate system).
When you define a stream, no additional storage is required in Sprucely and any request to view the generated dashboard will directly pull the latest data from this defined data source.
Step 2 : Configure Your Data Source
If your data source is not pre-defined in a fixed database format (for example, when you import a spreadsheet document), Sprucely will automatically analyze your data and auto-detect the most suitable region of the spreadsheet to import.
Sprucely will present you with the suggested data region and column headers of the data to import, but before proceeding, it will allow you to make any modifications if desired.
Step 3 : Define Your Priorities
In order for Sprucely to generate high-quality decision intelligence, you may optionally give it a few cues about which of the data columns are more or less relevant to the specific report you want to generate.
This input allows Sprucely to both optimize the data insights and generate a report that contains more information that is more relevant to your needs automatically.
Step 4 : Customize Your Dashboard
Sprucely will automatically generate a dashboard for you based on the data source and the preference cues you have provided. It’s easy to tailor the dashboard to your needs with the visual editor.
Using simple drag-and-drop actions combined with layout widgets, you can modify the dashboard layout exactly the way you want. You can also customize both function and style accordingly for all the widgets in the dashboard.
Aside from supporting embedded charts with interactive cross-filtering, the Sprucely data pipeline also allows you to reference input from multiple data sources at once. This allows you to create more complex dashboards with views from multiple data sources combined into one unified report.
Step 5 : Share the Dashboard
Having stored the dataset and dashboard either on the cloud or in your own network using the on-premise connector, you can now share the dashboard directly via e-mail with your audience.
You may also share your data intelligence reports from the Sprucely platform through one of the many integration options provided, i.e, embedding them into your web pages or presentations and documents using one of the Connector applications we provide.
PowerPoint Integration
Key Features
Interactive dashboard software with integration options enabling autonomous analytics as a service
Automated data format detection
Automated data region detection
Automated data sanitation
Automated dashboard layout generation
Automated dashboard key metrics and charts generation
Visual dashboard editor for easy customization of dashboard
Visual chart selector for easy selection of data and insight representations
Styles and theme support
Microsoft PowerPoint connector for integration
Google Docs connector for integration
Google Slides connector for integration
Use Cases
Automated dashboard generation from raw data sources
Automated visual analytics
Create dashboards from Excel data
Interactive charts presentation in PowerPoint (real-time data exploration during presentation)
Product Roadmap (2025)
Direct integration of interactive dashboards in software services
AI-assisted automated dashboard layout
AI-assisted automated insights generation
On-premise data storage
Deal Terms
Lifetime Access
Redeem your code within 60 days of purchase
30-Days Money-Back Guarantee (For Non-Prime Members and Regular users)
60-Day Money-Back Guarantee (For DealMirror Prime Members Only)
All Common Features Included
Corporate or personal user
1-D chart gadgets
2-D chart gadgets
3-D chart gadgets
Image gadgets
Text gadgets
Styling of gadgets
48 theme styles
Unlimited dashboards
Unlimited datasets
Unlimited rows per dataset
File upload
Web streams
JSON (.json)
Microsoft Excel (.xls/.xlsx)
OpenDocument sheets (.ods)
Parquet databases (.parquet)
Text files (.txt/.csv)
Direct link sharing
Web embeds
Copy to clipboard
Image raster (.png)
Image scalable (.svg)
Microsoft PowerPoint
Microsoft Word
Google Docs
Google Slides
Native printing
On-premise support (Coming Soon)
AI direct text query to Dashboard rendering (Coming Soon)
All sample templates (Coming Soon)
Adobe PDF (Coming Soon)
Intro Video
Roadmap & Use Cases:
Discount code auto-applied at checkout.
Sprucely: Transform Your Data into Interactive And Customizable Dashboards
One-time payment. Lifetime access.
What you get in this deal
All common features included above 100 MB storage space 10K Al credits (Coming Soon) On-premise support (Coming Soon)
Quickly convert complex data into interactive and visually engaging dashboards
Customizable layout and theme options to match your brand, with easy sharing and embedding
Alternative to: Tableau and Qlik
Best for: Executives, Finance, HR, Marketing, Medical, Projects and Sales
Sprucely Lifetime Deal
Are you a company owner struggling to make your dashboard visually appealing?
Look no further!
Meet Sprucely lifetime deal, a cutting-edge dashboard software that turns data into visually engaging, interactive decision intelligence. It automates your data insights pipeline, easily pulling data from multiple sources and transforming it into actionable insights in seconds.
With Sprucely, you can easily integrate real-time data and instantly visualise it, saving time and effort while enhancing your decision-making.
Whether you’re tracking sales, performance, or customer behaviour, Sprucely empowers you to visualize and make sense of your data instantly.
The built-in dashboard editor in Sprucely lets you customize layouts and themes, enabling you to incorporate your branding easily.
Once your dashboard is ready, you can share it via the web or embed it into documents, presentations, or websites—all in seconds.
Demo Video
Sprucely is a visual analytics software that automates data insights, transforming complex data into interactive, customizable dashboards for fast decision-making.
How Does It Work?
Step 1 : Select Your Data Source
The flow starts by defining the source of data. You can import into Sprucely a local data file (either for storage in the cloud or on-premise) or reference data that can be directly downloaded from a regular HTTP request (for example, JSON data that is served dynamically by a separate system).
When you define a stream, no additional storage is required in Sprucely and any request to view the generated dashboard will directly pull the latest data from this defined data source.
Step 2 : Configure Your Data Source
If your data source is not pre-defined in a fixed database format (for example, when you import a spreadsheet document), Sprucely will automatically analyze your data and auto-detect the most suitable region of the spreadsheet to import.
Sprucely will present you with the suggested data region and column headers of the data to import, but before proceeding, it will allow you to make any modifications if desired.
Step 3 : Define Your Priorities
In order for Sprucely to generate high-quality decision intelligence, you may optionally give it a few cues about which of the data columns are more or less relevant to the specific report you want to generate.
This input allows Sprucely to both optimize the data insights and generate a report that contains more information that is more relevant to your needs automatically.
Step 4 : Customize Your Dashboard
Sprucely will automatically generate a dashboard for you based on the data source and the preference cues you have provided. It’s easy to tailor the dashboard to your needs with the visual editor.
Using simple drag-and-drop actions combined with layout widgets, you can modify the dashboard layout exactly the way you want. You can also customize both function and style accordingly for all the widgets in the dashboard.
Aside from supporting embedded charts with interactive cross-filtering, the Sprucely data pipeline also allows you to reference input from multiple data sources at once. This allows you to create more complex dashboards with views from multiple data sources combined into one unified report.
Step 5 : Share the Dashboard
Having stored the dataset and dashboard either on the cloud or in your own network using the on-premise connector, you can now share the dashboard directly via e-mail with your audience.
You may also share your data intelligence reports from the Sprucely platform through one of the many integration options provided, i.e, embedding them into your web pages or presentations and documents using one of the Connector applications we provide.
PowerPoint Integration
Key Features
Interactive dashboard software with integration options enabling autonomous analytics as a service
Automated data format detection
Automated data region detection
Automated data sanitation
Automated dashboard layout generation
Automated dashboard key metrics and charts generation
Visual dashboard editor for easy customization of dashboard
Visual chart selector for easy selection of data and insight representations
Styles and theme support
Microsoft PowerPoint connector for integration
Google Docs connector for integration
Google Slides connector for integration
Use Cases
Automated dashboard generation from raw data sources
Automated visual analytics
Create dashboards from Excel data
Interactive charts presentation in PowerPoint (real-time data exploration during presentation)
Product Roadmap (2025)
Direct integration of interactive dashboards in software services
AI-assisted automated dashboard layout
AI-assisted automated insights generation
On-premise data storage
Deal Terms
Lifetime Access
Redeem your code within 60 days of purchase
30-Days Money-Back Guarantee (For Non-Prime Members and Regular users)
60-Day Money-Back Guarantee (For DealMirror Prime Members Only)
All Common Features Included
Corporate or personal user
1-D chart gadgets
2-D chart gadgets
3-D chart gadgets
Image gadgets
Text gadgets
Styling of gadgets
48 theme styles
Unlimited dashboards
Unlimited datasets
Unlimited rows per dataset
File upload
Web streams
JSON (.json)
Microsoft Excel (.xls/.xlsx)
OpenDocument sheets (.ods)
Parquet databases (.parquet)
Text files (.txt/.csv)
Direct link sharing
Web embeds
Copy to clipboard
Image raster (.png)
Image scalable (.svg)
Microsoft PowerPoint
Microsoft Word
Google Docs
Google Slides
Native printing
On-premise support (Coming Soon)
AI direct text query to Dashboard rendering (Coming Soon)
All sample templates (Coming Soon)
Adobe PDF (Coming Soon)
Pricing
Regular
One-time payment. Lifetime access.
$99.00$800.00
All common features included above
100 MB storage space
10K Al credits (Coming Soon)
On-premise support (Coming Soon)
AI direct text query to Dashboard rendering (Coming Soon)
All sample templates (Coming Soon)
Adobe PDF (Coming Soon)
Prioritized support
Logo-free dashboard embeds
Premium
One-time payment. Lifetime access.
$279.00$2800.00
All common features included above
1 GB storage space
50K Al credits (Coming Soon)
On-premise support (Coming Soon)
Sprucely.io JSON (Coming Soon)
REST API endpoint (Coming Soon)
Automated remote computer access (Coming Soon)
2 site access tokens (Coming Soon)
Prioritized support
Logo-free dashboard embeds
From The Founders
Erik Unemyr
Founder
Sprucely.io is a new solution that makes visual data analytics more accessible than ever!
It is a cloud-based dashboard service that automatically generates dashboards and visual insights from your spreadsheets and other data sources.
Use it to perform data exploration and create interactive reports directly through your browser to share, present directly in PowerPoint, or integrate with your software services. In seconds.
2. Where are the database and storage located (Data Residency)?
Database and storage are located in the United States.
Reviews
5 reviews for Sprucely: Transform Your Data into Interactive And Customizable Dashboards
Rated 5 out of 5
Shiva Kumar –
Do they offer a free trial?
Admin –
Yes, you can start with the free tier of https://www.sprucely.io/service/signup/ (it does not have any time limit!), and upgrade later when you would like to.
Rated 5 out of 5
Mabel Aye –
Can it also read images besides text and tables?
Admin –
Yes the dashboards are fully customizable using a visual drag’n drop editor.
Rated 5 out of 5
Choy CM –
Any limit of excel file size or row of record/ column per file?
Admin –
Sprucely.io supports the maximum number of rows that the Excel file format allows. We have tested with files with about 1 million records and several columns of data in different format without any issues with Sprucely.io.
Rated 5 out of 5
HM Shuja –
Can I customize the data dashboard? Is it BYOK?
Admin –
We don’t have BYOK but on-premise support is in the roadmap.
Rated 5 out of 5
Ds Wong –
Does it integrate with any seo tools to create seo data dashboard?
Admin –
There is no native integration with SEO tools specifically, but you could definately import data exported from your SEO tool (in Excel, JSON, CSV text format, etc.) into Sprucely.io to create an interactive dashboard and perform data exploration of that dataset.
Admin –
Sprucely does not support PDF-based table import as of current


5 reviews for Sprucely: Transform Your Data into Interactive And Customizable Dashboards
Shiva Kumar –
Do they offer a free trial?
Admin –
Yes, you can start with the free tier of https://www.sprucely.io/service/signup/ (it does not have any time limit!), and upgrade later when you would like to.
Mabel Aye –
Can it also read images besides text and tables?
Admin –
Yes the dashboards are fully customizable using a visual drag’n drop editor.
Choy CM –
Any limit of excel file size or row of record/ column per file?
Admin –
Sprucely.io supports the maximum number of rows that the Excel file format allows. We have tested with files with about 1 million records and several columns of data in different format without any issues with Sprucely.io.
HM Shuja –
Can I customize the data dashboard? Is it BYOK?
Admin –
We don’t have BYOK but on-premise support is in the roadmap.
Ds Wong –
Does it integrate with any seo tools to create seo data dashboard?
Admin –
There is no native integration with SEO tools specifically, but you could definately import data exported from your SEO tool (in Excel, JSON, CSV text format, etc.) into Sprucely.io to create an interactive dashboard and perform data exploration of that dataset.
Admin –
Sprucely does not support PDF-based table import as of current